Amateur Radio Public Seismic Network
Note: I use JavaScript (located via page source and available) to round picture corners on other pages at this site.
If
this picture (![]() )
does not present itself correctly, part of the JavaScript in your browser
is broken. (fwiw) The broken image will now allow one, with broken JavaScript,
to see all images, sans rounded corners. Firefox is a free browser,
for most platforms, that will fix this problem, and available at mozilla.com
)
does not present itself correctly, part of the JavaScript in your browser
is broken. (fwiw) The broken image will now allow one, with broken JavaScript,
to see all images, sans rounded corners. Firefox is a free browser,
for most platforms, that will fix this problem, and available at mozilla.com
Text size can increased/decreased using + and - keys, while, on a PC: pressing and holding control key and on a Mac: pressing and holding command (Apple) key.
A New Look at an Old Tool:
the Cumulative Spectral Power of Fast-Fourier Transform Analysis
Sheng-Chiang Lee and Randall D. Peters
Physics Department, Mercer University, Macon, GA 31207
http://www.flyingsnail.com/AmateurRadio/VolksMeter-FFT-CSP.html
February

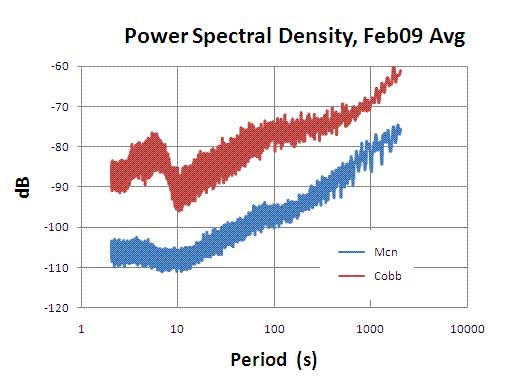
Power Spectral Density February Averages Macon, GA (blue) - Cobb, CA (red)

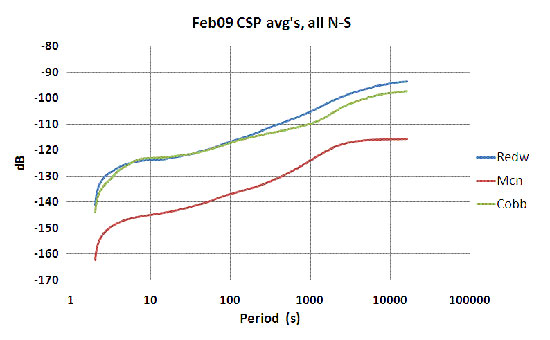
February Comparison N/S CSP Averages - Macon, GA - Cobb, CA - Redwood City, CA
![Average of the Feb CSP curves for Cobb [Mountain] CA VolksMeter N-S channel Average of the Feb CSP curves for Cobb [Mountain] CA VolksMeter N-S channel](../images/CobbFebCSPavgN-S.jpg)
Average Feb CSP Cobb Curves VolksMeter N-S Channel - large image
![FFT-CSP of First 10 days of February, Cobb [Mountain] Ca. FFT-CSP of First 10 days of February, Cobb [Mountain] Ca.](../images/1st-10daysFebE-W.jpg)
CSP, 1st 10 days - February 2009, E-W VolksMeter channel, Cobb [Mountain], CA - large image

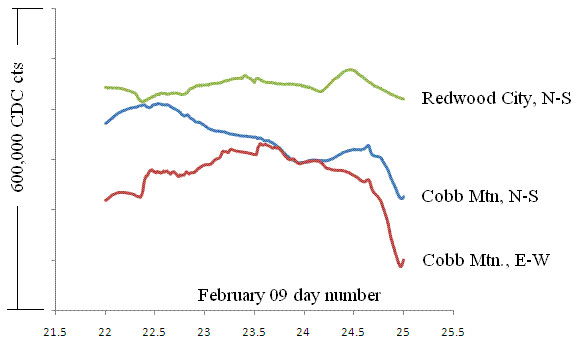
Click for large image - February 22-25, 2009
All VolksMeter Averaging Images provided by Randall Peters
The above video is a nice depiction of how the eigenmodes of a plate change with increasing forcing frequency.
 -
- 
Current extent and position of auroral oval at each pole. Click image to go to page.
If anyone owning a PC, Macbook, or Macbook Pro is interested in Earthquakes and would like a FREE way to monitor them, check out the current progress log page provided by ARPSN (Amateur Radio Public Seismic Network) for a guideline.
